
Overview Metrics
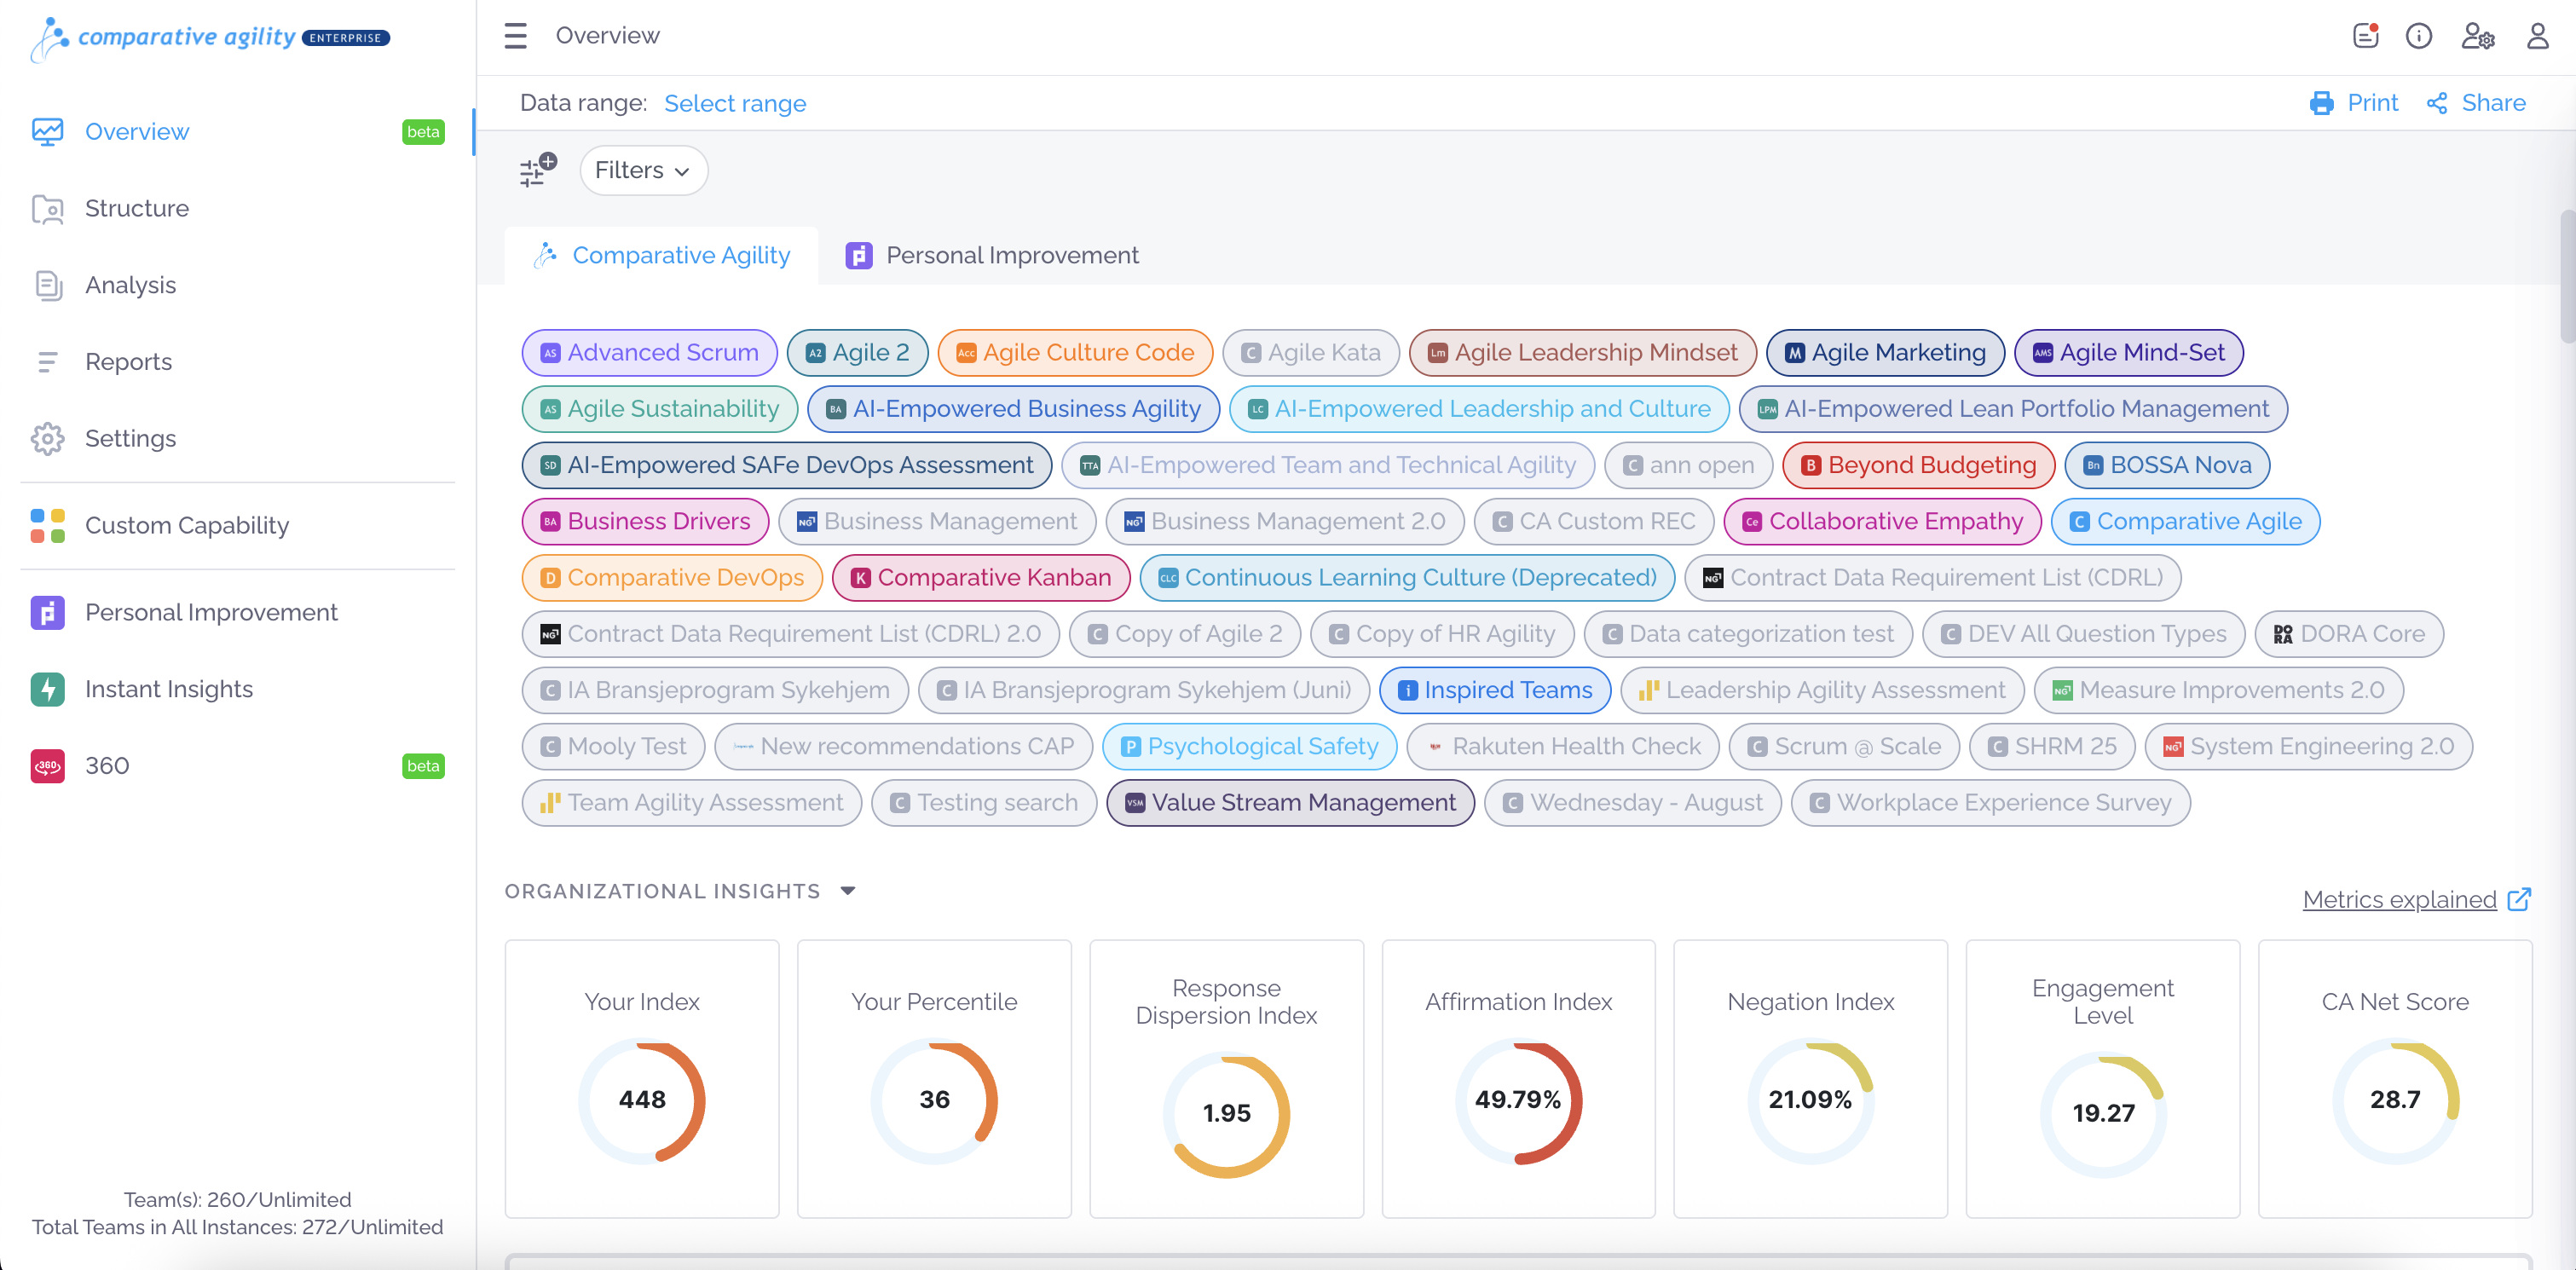
Your Index and Your Percentile
Section titled “Your Index and Your Percentile”The CA Index is a proprietary metric from 0 – 1000 that provides a comprehensive measure of your organization’s overall agility. It leverages your complete dataset, incorporating performance, cohesion, and proprietary weightings to deliver a holistic agility assessment.
The percentile reflects how your organization compares to others in our dataset. It represents the percentage of organizations that score lower than yours. For example, a percentile of 67 means your organization outperforms 67% of organizations on the CA Index.
Response Dispersion Index (RDI)
Section titled “Response Dispersion Index (RDI)”**The Response Dispersion Index (RDI) **measures how spread-out responses are across the Likert scale, using standard deviation to indicate variation in sentiment. A lower RDI suggests a high level of cohesion and alignment, while a higher RDI signals polarization or disagreement among respondents.
**Why it matters? ** The central hypothesis behind RDI is that less dispersion within an organization is generally beneficial. While healthy debate and differing perspectives are valuable, a high degree of alignment in ways of working can act as a proxy for organizational agility. When employees share a common understanding and approach, decision-making and collaboration become more efficient and effective.
Since lower RDI values indicate greater alignment, the best-performing organizations will be those with the lowest dispersion in responses, reflecting stronger cohesion and shared ways of working.
- Transformational Agility: RDI < (20th percentile) - Advanced Agility: (20th percentile) ≤ RDI < (40th percentile) - Progressive Agility: (40th percentile) ≤ RDI < (60th percentile) **- Foundational Agility: **(60th percentile) ≤ RDI < (80th percentile) **- Nascent Agility: **RDI ≥ (80th percentile)
Affirmation Index
Section titled “Affirmation Index”The Affirmation Index quantifies the percentage of respondents who positively endorse a given survey item by selecting a 4 or 5 on a 5-point Likert scale. This metric serves as a key indicator of employee alignment, support, and confidence in the practices, initiatives, or cultural elements being assessed.
**Why it matters? ** By measuring affirmation levels, organizations gain valuable insights into:
- Areas where employees feel aligned, engaged, and confident.
- Aspects where there may be uncertainty, skepticism, or resistance.
- The effectiveness of** leadership, processes, and cultural transformation efforts.**
A high Affirmation Index suggests strong collective agreement and perceived effectiveness, while a low score may indicate misalignment, lack of clarity, or barriers to adoption.
**Practical Applications ** This metric is especially useful in organizational change efforts, as it enables leaders to:
- **Track buy-in and confidence **in new processes, leadership, and cultural shifts.
- Monitor alignment trends over time to assess the impact of change initiatives.
- **Pinpoint specific areas needing improvement **to drive more effective engagement strategies.
Negation Index
Section titled “Negation Index”The Negation Index quantifies the percentage of respondents who disagree with a given survey item, as indicated by selecting a 1 or 2 on a 5-point Likert scale. This metric helps organizations identify levels of opposition, skepticism, or misalignment regarding practices, initiatives, or cultural elements being assessed.
**Why it matters? ** By tracking negation levels, organizations can:
Identify resistance hotspots where employees struggle with adoption or trust.
- Uncover areas of confusion or dissatisfaction that may hinder engagement.
- Gauge the effectiveness of change efforts by monitoring shifts in sentiment over time.
A high Negation Index signals strong resistance, lack of trust, or disengagement, while a low Negation Indexsuggests broad acceptance or neutrality.
**Practical Applications ** This metric is especially valuable in organizational change efforts, enabling leaders to:
- **Pinpoint areas requiring additional support, training, or clarification.
- **Refine communication strategies to address concerns and improve alignment.
- Track sentiment shifts as initiatives evolve, ensuring continuous improvement.
**Complementary Insights with the Affirmation Index ** When analyzed alongside the Affirmation Index, the Negation Index provides a comprehensive view of organizational sentiment. This dual perspective helps organizations:
- **Balance positive and negative sentiment insights for more informed decision-making.
- Reduce friction and resistance by proactively addressing concerns.
- Foster a culture of continuous engagement and growth through targeted improvements.**
Engagement Score
Section titled “Engagement Score”The Engagement Score represents the percentage of survey responses that are either “N/A” or “3” on a 5-point Likert scale, indicating neutral or non-applicable responses. This metric helps assess how engaged respondents are with the survey topics and whether they feel strongly about the concepts being evaluated.
**Why it matters? ** Our hypothesis suggests that organizations with high levels of neutral engagement—where respondents frequently select neutral (3) or N/A responses—may also struggle with agility and transformational progress. To validate this, we analyzed correlations between the CA Index (a measure of overall organizational agility) and Engagement Scores.
**Key Findings **
- High Engagement Scores (more neutral/N/A responses) correlate with lower CA Index scores, suggesting that organizations where employees are disengaged or indifferent tend to struggle with agility.
- Conversely, organizations with lower Engagement Scores (fewer neutral responses) tend to score higher on the CA Index, indicating higher levels of clarity, commitment, and engagement in transformation efforts.
**Implications for Organizations ** **A high Engagement Score (high neutrality) may indicate: **
- Unclear or unimpactful survey questions that fail to resonate.
- A lack of strong opinions or emotional investment, signaling potential disengagement.
- Resistance to change or uncertainty about transformation initiatives.
CA Net Score (CNS)
Section titled “CA Net Score (CNS)”A higher CNS indicates stronger agility and transformation success, while a lower score suggests challenges in adoption and alignment. Organizations are classified into five performance tiers:
**1. - Nascent Agility (Red) – Below 7 ** Facing significant challenges in transformation efforts. Low or negative scores indicate misalignment, resistance, or disengagement.
**2. Foundational Agility (Orange) – 7 to 16 ** Early signs of improvement, but progress is still limited. Requires continued focus on alignment, engagement, and operational improvements.
**3. Progressive Agility (Yellow) – 16 to 27 ** Indicates steady progress toward agility. Some teams are aligned, but opportunities remain for broader adoption.
**4. Advanced Agility (Light Green) – 27 to 42 ** Strong performance with high engagement and net positive sentiment. Teams are largely aligned and operating effectively within agile frameworks.
**5. Transformational Agility (Dark Green) – Above 42 ** Represents exceptional organizational agility and alignment. These organizations are highly engaged, adaptive, and delivering strong results.
**Why it matters? ** Simplifies complex sentiment data into a single, meaningful score. Helps leaders quickly assess transformation progress across the organization. Identifies areas needing attention to drive continuous improvement. Enables trend tracking to measure whether initiatives are positively impacting agility.